Zachary Labe is a climate scientist with a knack for presenting his work accessibly. He maintains an influential blog of data visualizations regarding trends in Arctic and Antarctic climate, and is often consulted in media coverage of extreme climate events in those regions.
Zack recently joined the Barnes Group as a postdoctoral researcher in CSU’s Department of Atmospheric Science. SOURCE caught up with him while he was still unpacking, for a chat about his work.

Q: You just completed your doctorate – congratulations! What factors led you to choose CSU as your next step?
It was Libby [Barnes]. She gave a presentation at a conference on Arctic/mid-latitude interactions, and seemed really enthusiastic about the science. I was interested in her new work on machine learning and climate change variability, and I wanted to expand my skill set. So I thought it’d be a good post-doc position to add another tool to my toolbox for analyzing climate change.
The work the Barnes Group is doing is state-of-the-art – new science, new methods. It’s really important.
Q: What is the focus of your research?
For my Ph.D., I was trying to understand how Arctic climate change, especially loss of sea ice, might impact weather conditions in lower latitudes. It remains a very difficult question, especially in real time.
I mentioned machine learning – I’m going to be thinking about how we can use these new statistical tools to better disentangle climate change from climate variability. How can we find patterns that might be important for understanding climate change? Another goal will be looking at what we call compound events, where we consider the impact of other variables in addition to temperature. And extreme events in the Arctic – temperatures above freezing during the winter, for example. I hope to continue working to understand how frequent they will be in the future.
Q: You publish some very accessible visualizations of Arctic climate data on your blog and Twitter account. How are these visualizations useful to you as a scientist?
I remember being frustrated reading journal articles. Even I couldn’t understand these important climate graphs, let alone a broader audience, and I thought, “There’s got to be a better way to present this data while still staying true to the science.”
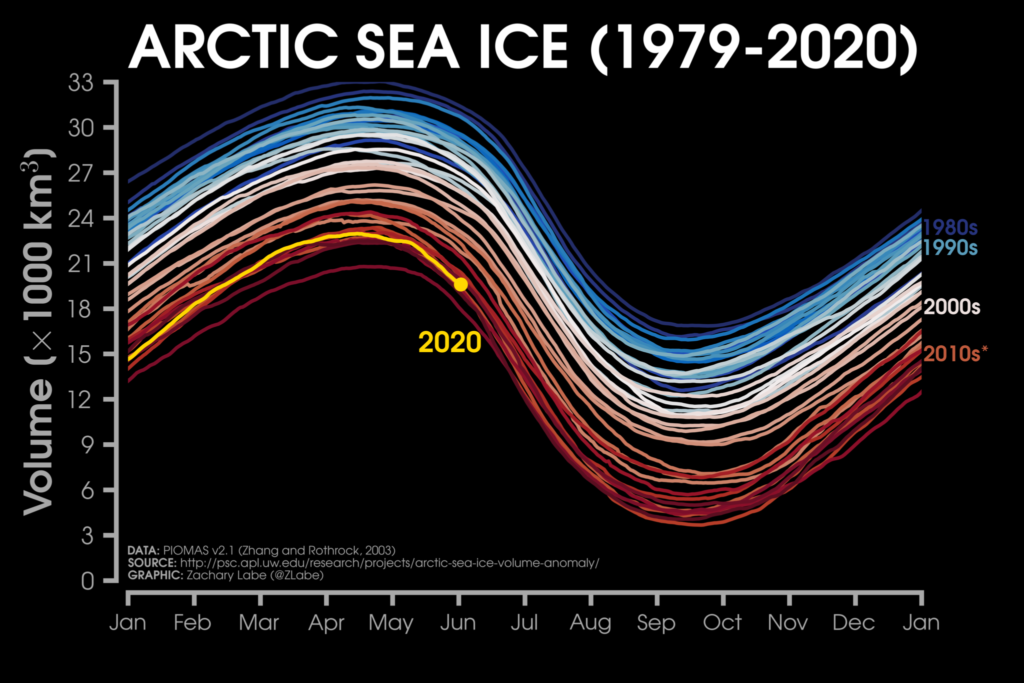
I want to present Arctic climate change and show not just one data source, but lots of data sources that corroborate the main idea of what’s happening. So I use satellite data, climate model data, weather station data, to show that all these different sources from science institutions all over the world, all basically tell the same story.
It takes a lot of time to make all of these graphics, but it’s made me a much better scientist, particularly in the Arctic climate world. The scientific publication process is years behind, sometimes, publishing tomorrow on sea ice back in 2018, and things have already changed. So, monitoring the numbers in real time gives me a really good idea of the types of problems we should be thinking about.
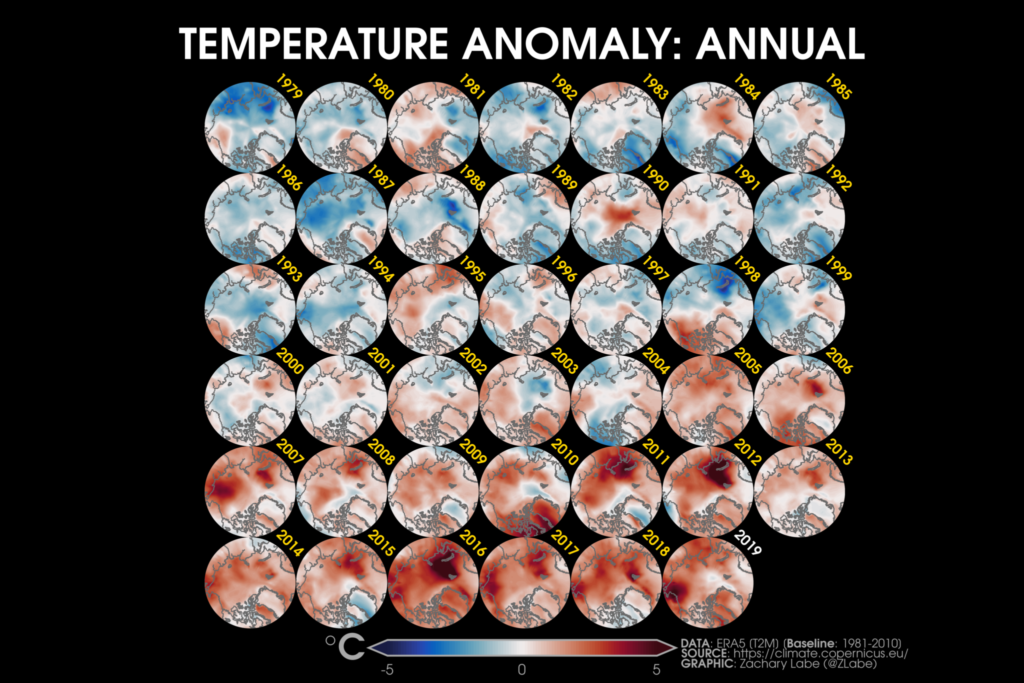
I try to provide context. Like this graphic: the circles show extremes every single year. One year might be warmer or colder than the other, but you can also see the long-term trend that it’s gradually getting warmer.
And that’s how I like to communicate climate change. Focus on the long-term trends.
Q: Knowing what you do, are you an optimist or a pessimist about the future?
Oh, a bit both. This 2 degrees of warming target that we often talk about, I’m a pessimist about that. It’s going to be nearly impossible to stay within 2 degrees of warming just based on trends of cleaning up fossil fuel emissions.
But I’m an optimist in the longer term. I don’t foresee severe climate change at the end of the 21st century. We are at a crucial period where, very shortly, we will have to become very innovative and invested in reducing greenhouse gas emissions. But in the long term, I don’t think we’re headed toward the worst-case scenario.
If you asked me what I was most afraid of, it’s the misconception that climate scientists are behind the scenes, like, massaging the data, or that our data is a secret, and it’s really not the case. All of our data is publicly available, and all of our computer code is publicly available.
Q: What advice do you have for people who would like to contribute to this field, whether as a hobby or a career?
There’s some cool community science work going on. The best example I can think of is called “Old Weather.” Volunteers transcribe old ship records from whaling ships and such, and the data is used to reconstruct sea ice records going back into the 1800s. Another example: since the early 1900s, citizen scientists have been keeping track of when plants bloom or leaf out in the spring. Using this data in my undergraduate research, we were able to build a statistical model for the timing of spring, and use that to simulate how climate change will impact the timing of spring in the future.
So public science work is remarkably important in climate science.
Climate science is interesting because it encompasses so many fields. You can focus on any aspect. If you’re interested in policy, law, ecology, field work, programming, writing. (Science is, I’ve learned, mostly writing. [laughs]) There are so many aspects!